It takes a while to transfer 162.4 million rows of data from a local SQL database to a remote Azure Tables collection. So far, after 4 hours and 20 minutes, I've transferred just over 4 million rows. That works out to about 260 rows per second, or 932,000 per hour. So, yes, the entire transfer will take 174 hours.
Good thing it can run in the background. Also, because it cycles through three distinct phases (disk-intensive data read, processor-intensive data transformation, and network-intensive data write), it doesn't really take a lot of effort for my computer to handle it. In fact, network writes take 75% of the cycle time for each batch of reports, because the Azure Tables API takes batches of 100 rows at a time.
Now, you might wonder why I don't just push the import code up to Azure and speed up the network writes a bit. Well, yes, I thought of that, but decided against the effort and cost. To do that, I would have to upload a SQL backup file to a SQL VM big enough to take a SQL Server instance. Any VM big enough to do that would cost about 67¢ per hour. So even if I cut the total time in half, it would still cost me $60 or so to do the transfer. That's an entire bottle of Bourbon's worth just to speed up something for a hobby project by a couple of days.
Speaking of cost, how much will all this data add to my Azure bill? Well, I estimate the entire archive of 2009-2022 data will come to about 50 gigabytes. The 2003-2009 data will probably add another 30. Azure Tables cost 6¢ per gigabyte per month for the geographically-redundant storage I use. I will leave the rest of the calculation as an exercise for the reader.
Update: I just made a minor change to the import code, and got a bit of a performance bump. We're now up to 381 rows per second, 46% faster than before, which means the upload should finish in only 114 hours or 4.7 days. All right, let's see if we're done early Monday morning after all! (It's already almost done with Canada, too!)
The data transfer from Weather Now v3 to v5 continues in the background. Before running it, I did a simple SQL query to find out how many readings each station reported between September 2009 and March 2013. The results surprised me a bit:
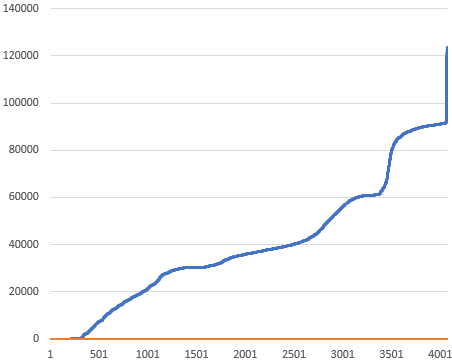
The v3 database recorded 162.4 million readings from 4,071 stations. Fully 75 of them only have one report, and digging in I can see that a lot of those don't have any data. Another 185 have fewer than 100, and a total of 573 have fewer than 10,000.
At the other end, Anderson AFB on Guam has 123,394 reports, Spangdahlem AB in Germany has 123,297, and Leeuwarden, Netherlands, has 119,533. In fact, seven Dutch weather stations account for 761,000 reports of the 162 million in the archive. I don't know why, but I'll find out at some point. (It looks like some of them have multiple weather recording devices with color designations. I'll do some more digging.)
How many should they have? Well, the archive contains 1,285 days of records. That's about 31,000 hourly reports or 93,000 20-minute updates—exactly where the chart plateaus. Chicago O'Hare, which reports hourly plus when the weather shifts significantly had 37,069 reports. Half Moon Bay, Calif., which just ticks along on autopilot without a human weather observer to trigger special reports, had 90,958. So the numbers check out pretty well. (The most prolific US-based station, whose 91,083 reports made the 10th most prolific in the world, was Union County Airport in Marysville, Ohio.)
Finally, I know that what the App has a lot of data sloppiness right now. After I transfer over these archives, I'll work on importing the FAA Airports database, which will fix the names and locations of most of the US stations.
Sunday night I finished moving all the Weather Now v4 data to v5. The v4 archives went back to March 2013, but the UI made that difficult to discover. I've also started moving v3 data, which would bring the archives back to September 2009. I think once I get that done then moving the v2 data (back to early 2003) will be as simple as connecting the 2009 import to the 2003 database. Then, someday, I'll import data from other sources, like NCEI (formerly NCDC) and the Met*, to really flesh out the archives.
One of the coolest parts of this is that you can get to every single archival report through a simple URL. For example, to see the weather in Chicago five years ago, simply go to https://wx-now.com/History/KORD/2017/03/30. From there, you can drill into each individual report (like the one from 6pm) or use the navigation buttons at the bottom to browse the data.
Meanwhile, work continues apace on importing geographic data. And I have discovered a couple of UI bugs, including a memory leak that caused the app to crash twice since launch. Oops.
* The Met has really cool archives, some of which go back to the 1850s.
I won't belabor the point, or even inject my own opinion about Will Smith's Oscars meltdown Sunday night, except to say I'm amazed at how many articles, columns, and Tweets have appeared about it. I guess nothing else in the world matters right now?
I took Cassie for a 40-minute walk around Lexington's historic district on the way back from Berea:


The light really wasn't great, so I didn't take a lot of photos. Plus Cassie has a way of adding motion blur to every photo I shoot.
Two weeks ago I attended a conference by the Chicago River, which had dye left over from St Patrick's Day. Add a passing fire boat and it's Christmas in March:

Editing photos on my phone doesn't always produce the best results. Faster, cheaper, better, pick two, right? Fortunately I have Adobe Lightroom at home, and deploying software yesterday took a long time.
Here are my re-edits. Better? Worse? At the very least, they're all correctly-proportioned (2x3) instead of whatever I guessed on my little phone screen.
Thursday's sunrise at Nicura Ranch:

Berea College:

One of the ranch's permanent residents:
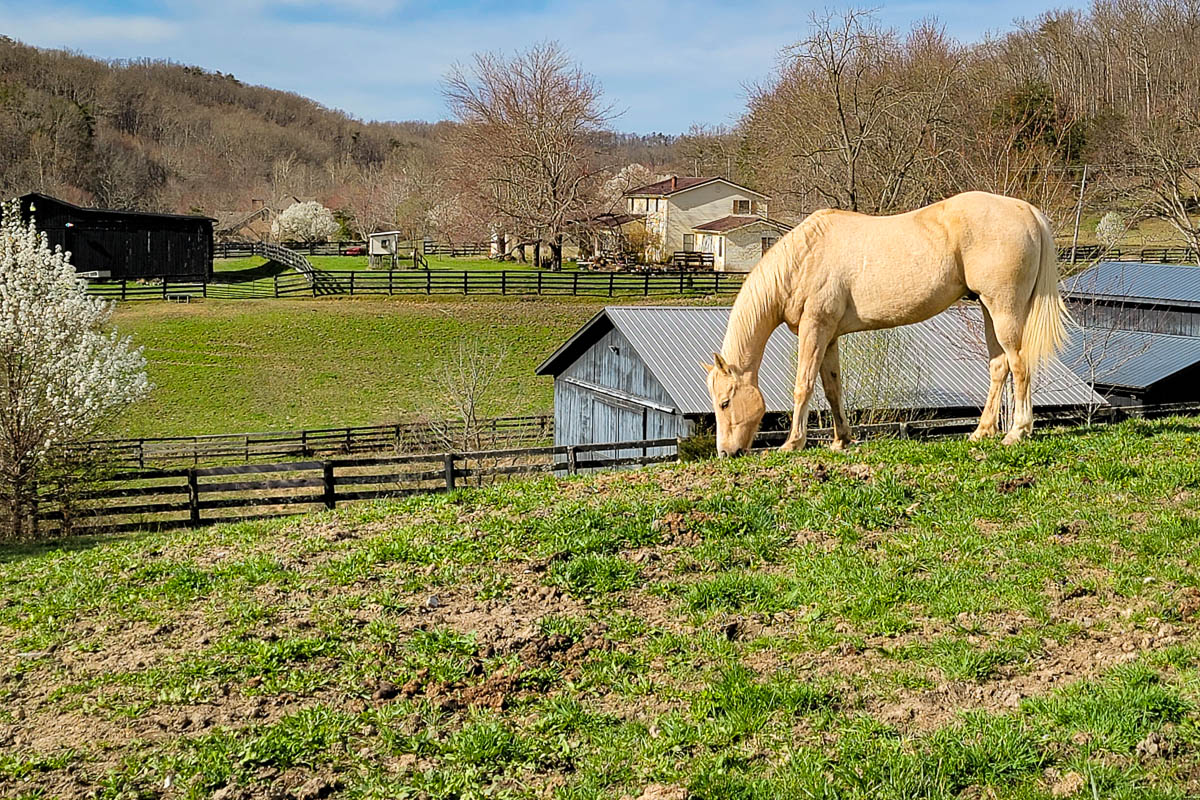
Down the road from the ranch:

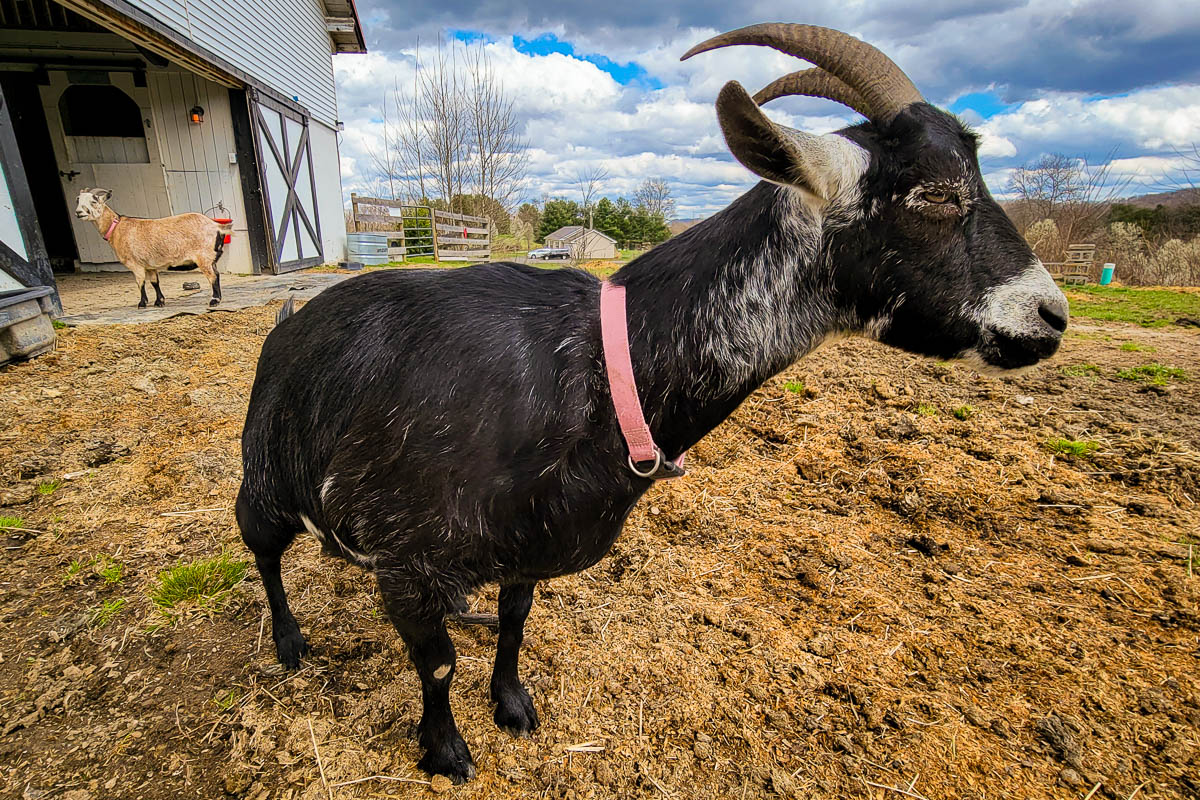
Cinnamon, who rather preferred that I keep Cassie outside the pasture, thank you very much:
I've got a couple more from the past two weeks I'll post after lunch.
I've just switched the DNS entries for wx-now.com over to the v5 App, and I've turned off the v4 App and worker role. It'll take some time to transfer over the 360 GB of archival data, and to upload the 9 million rows of Gazetteer data, however. I've set up a virtual machine in my Azure subscription specifically to do that.
This has been quite a lift. Check out the About... page for the whole history of the application. And watch this space over the next few months for more information about how the app works, and what development choices I made (and why).
Just for posterity, here's what the v4 Current Weather page looked like:
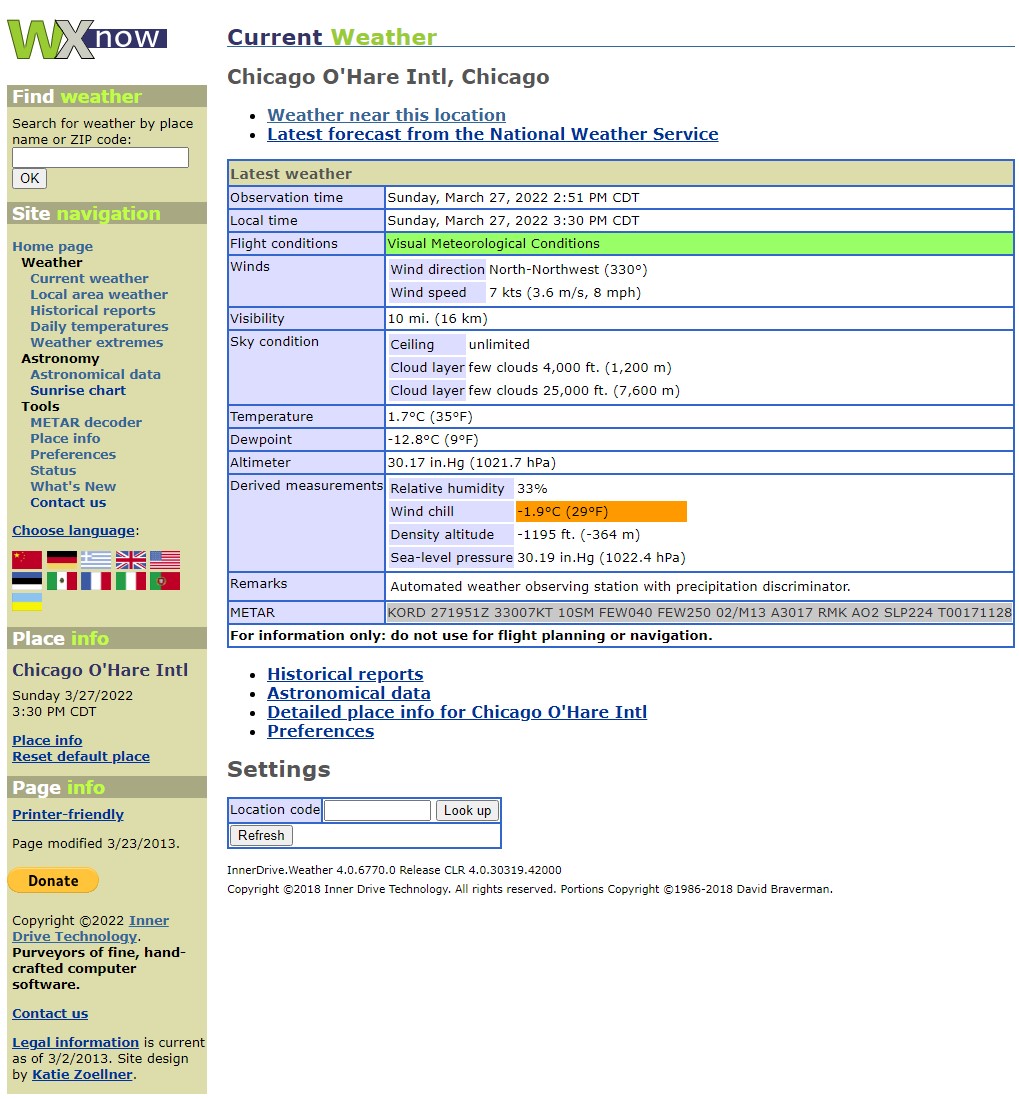
Good night, v4. You had a good 8-year run. And good night, Katie Zoellner's lovely design, which debuted 15 years ago.
We're about to get back on the road for our 700 km drive back to Chicago. Before leaving, I just wanted to highlight Ravinia Festival's upcoming 2022 season. In particular, note who they're partnering with for these performances of La Clemenza di Tito and Don Giovanni.
Oh, yes, I will be there.
The day started like this:

Then it became this:

And returned to this:
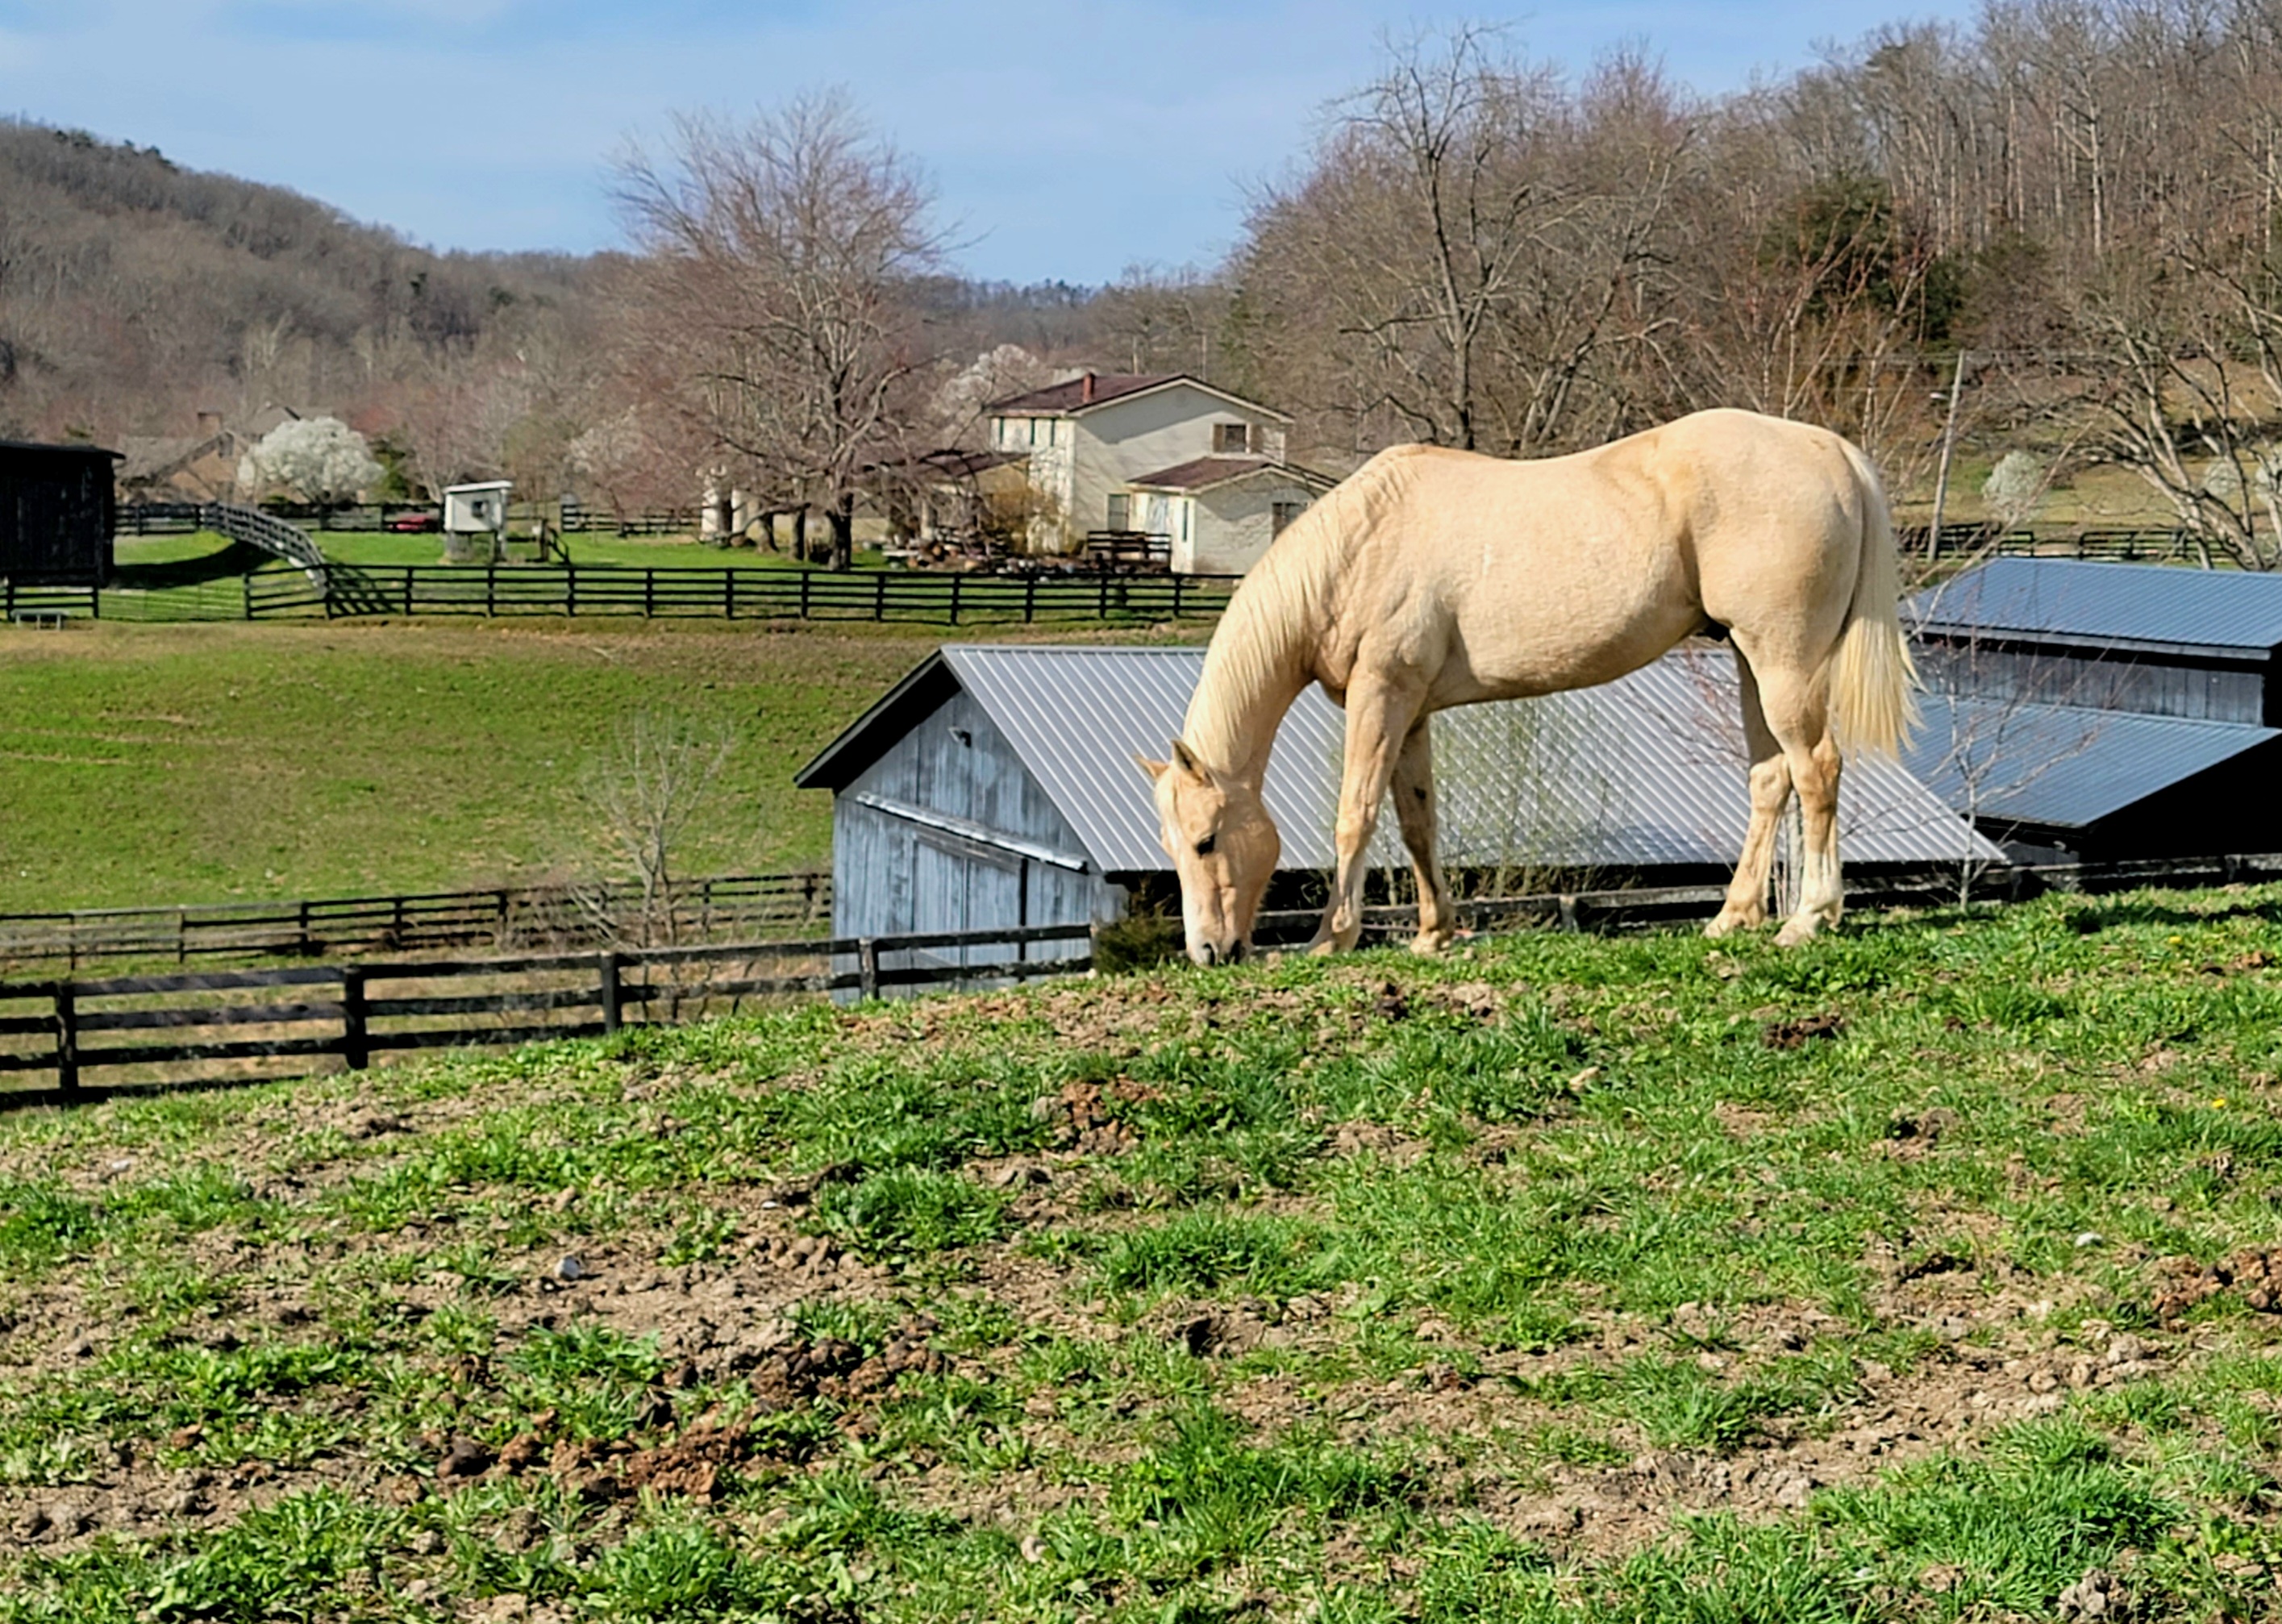
But because of this:
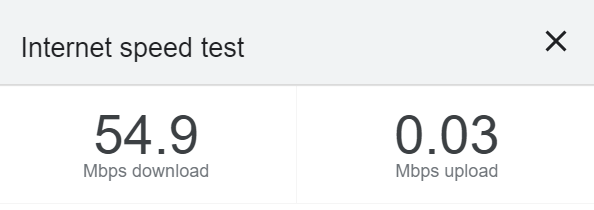
It is now this:

As for the horses and goats on the ranch, I had some challenges introducing Cassie to them. The principal challenge was Cassie barking her head off at all of them, which two of the horses and both of the goats wanted nothing to do with, but one of the horses looked ready to teach Cassie the formula F=ma in a direct and possibly painful way.
Now that I've downloaded 12 hours of email and figured out where to have dinner later, I'm going to head back and hope that Cassie hasn't figured out how to open doors.
(Also, I'll edit the photos properly when I get home and possibly re-post them.)
Cassie and I are at a lovely ranch in Kentucky where tomorrow she'll meet goats and tonight I've met a 1990s-era Internet connection. Well, I didn't come here to surf the Web, so I'll just deal.
Meanwhile, I'm sitting outside listening to frogs. Lots of frogs. And a hound somewhere down the road.